|
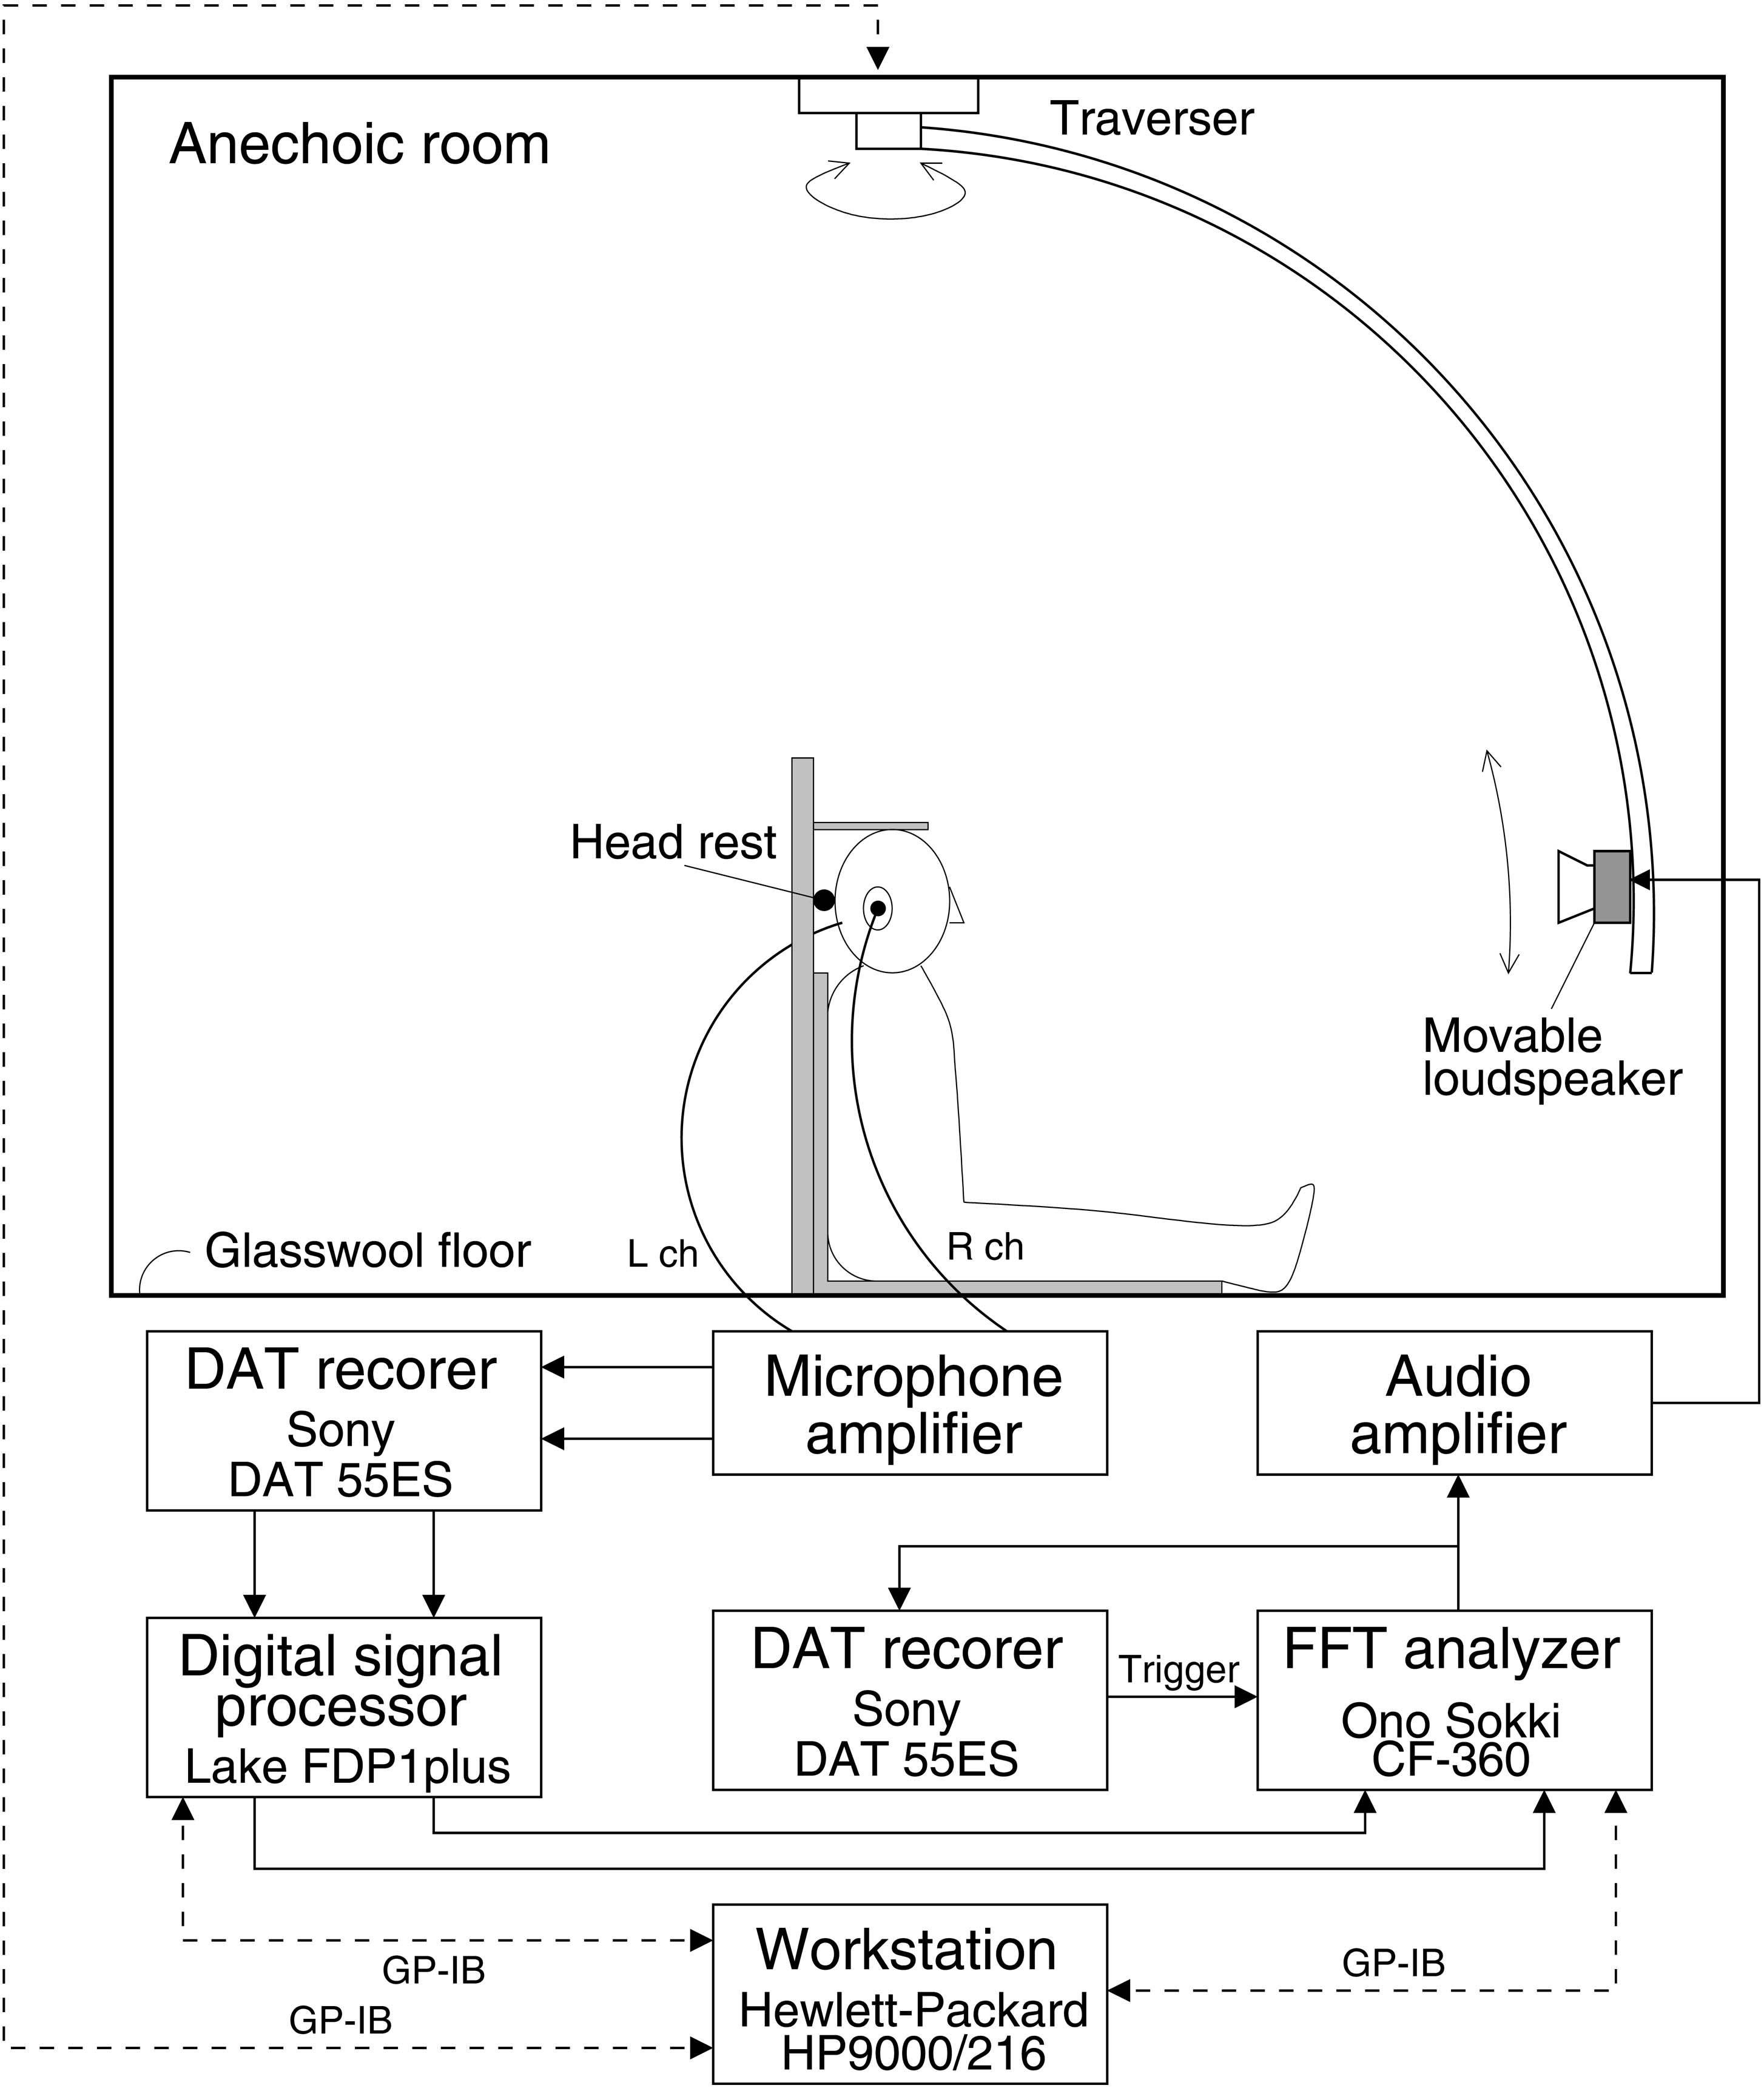
The measurement was carried out in the anechoic room of the Institute of
Technology, Shimizu Corporation. Setup of the measurement system is
illustrated in Figure 1. The subject sat on the floor made
of glasswool sheets with his head fixed to the head rest. Sound signal
was radiated from the loudspeaker attached to the traverser fixed to the
ceiling of the anechoic room. Arm of the traverser can be rotated in
arbitrary angles, and the position of the loudspeaker can be moved in
arbitrary position along the arm. This enables the loudspeaker to be
positioned in arbitrary position on the upper hemisphere around the
subject. The radius of the sphere is 1.2 m. Time Stretched Pulse
(TSP) was used as the sound signal radiated from the loudspeaker. Small
electret microphones were adjusted to the entrances of the subject's
both ears using thin metal wires. Output of the microphones was
amplified by the hand-made amplifier, then A/D-converted to the digital
signal processor unit, where the inverse filter of TSP was convolved
with the response. Sampling frequency was 44.1 kHz, and the measured
responses were time-averaged by eight times per a single measurement
point.
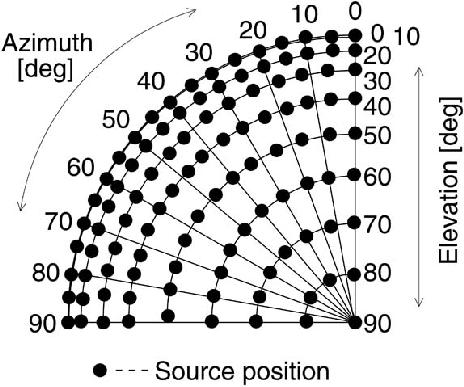
Figure 2: Measured source direction (Top view)
(Click of the figure shows the larger one (JPEG, 206 kB))
EPS+gzip file (2609 Bytes)
In the conditions mentioned above, HRTFs of three male subjects in
almost whole directions on upper hemisphere were measured. Positions of
the sound source were depicted in \reffig{source-position}. As shown in
this figure, interval of azimuthal angle was changed depending on the
elevation, which was set at every 10 degrees. Change of interval angle
with elevation is summarized in \reftbl{interval}. Resulting number of
measurement points was 430. Since the entire measurement needed too
long time for each subject to sit still, eight to nine rests were
inserted during the measurement. As a result, about four hours were
spent per one subject for the measurement of the whole set of HRTFs.
Table 1: Change in number of measured angles with
elevation
| Elevation [deg] | Angular step [deg] | Number of points |
|---|
| 0 | 5 | 72 |
|---|
| 10 | 5 | 72 |
|---|
| 20 | 5 | 72 |
|---|
| 30 | 6 | 60 |
|---|
| 40 | 6 | 60 |
|---|
| 50 | 8 | 45 |
|---|
| 60 | 10 | 36 |
|---|
| 70 | 15 | 24 |
|---|
| 80 | 30 | 12 |
|---|
| 90 | --- | 1 |
|---|
| Total | | 454 |
|---|
The rectangular window of 512 points long was applied to each measured
response. The time windowing was so positioned that the sample with the maximum
amplitude came around the center of the window while keeping the
relative timing/delay among the impulse responses intact. More
detailed explanation of the windowing is as follows:
- First, the impulse response with the longest delay is
selected. This usually corresponds to the direction of opposite side
of the ear measured. Then, the center of the window was set to the
position of the sample with the maximum amplitude.
- Then, the same positioning was applied to the other responses by
keeping relative time between responses. This enables to keep the
relative timing/delay among the impulse responses intact.
- J. Blauert, Spatial Hearing (MIT Press)
...Definition of HRTF, spatial hearing
- Yôiti Suzuki, Futoshi Asano, Hack-Yoon Kim and Toshio Sone,
"An optimum computer-generated pulse signal suitable for the
measurement of very long impulse responses,"
J. Acoust. Soc. Am., 97(2),
1119-1123(1995).
...on Time-Stretched Pulse (TSP)
|